Evolutionary Coupling Analysis
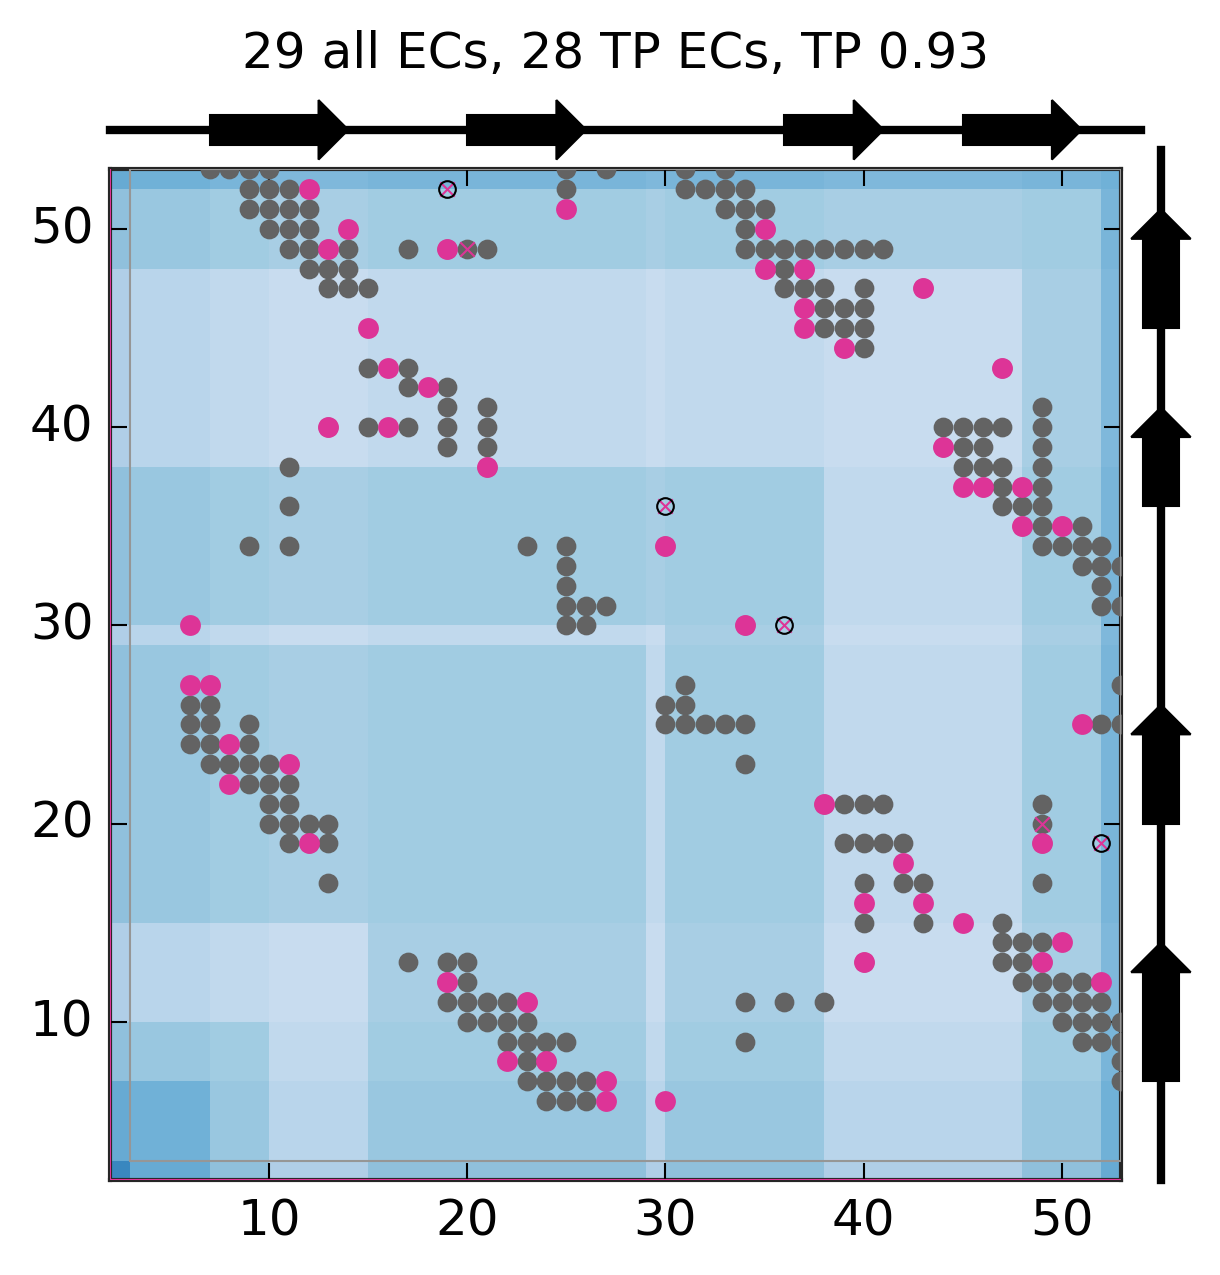
Predicted and experimental contacts
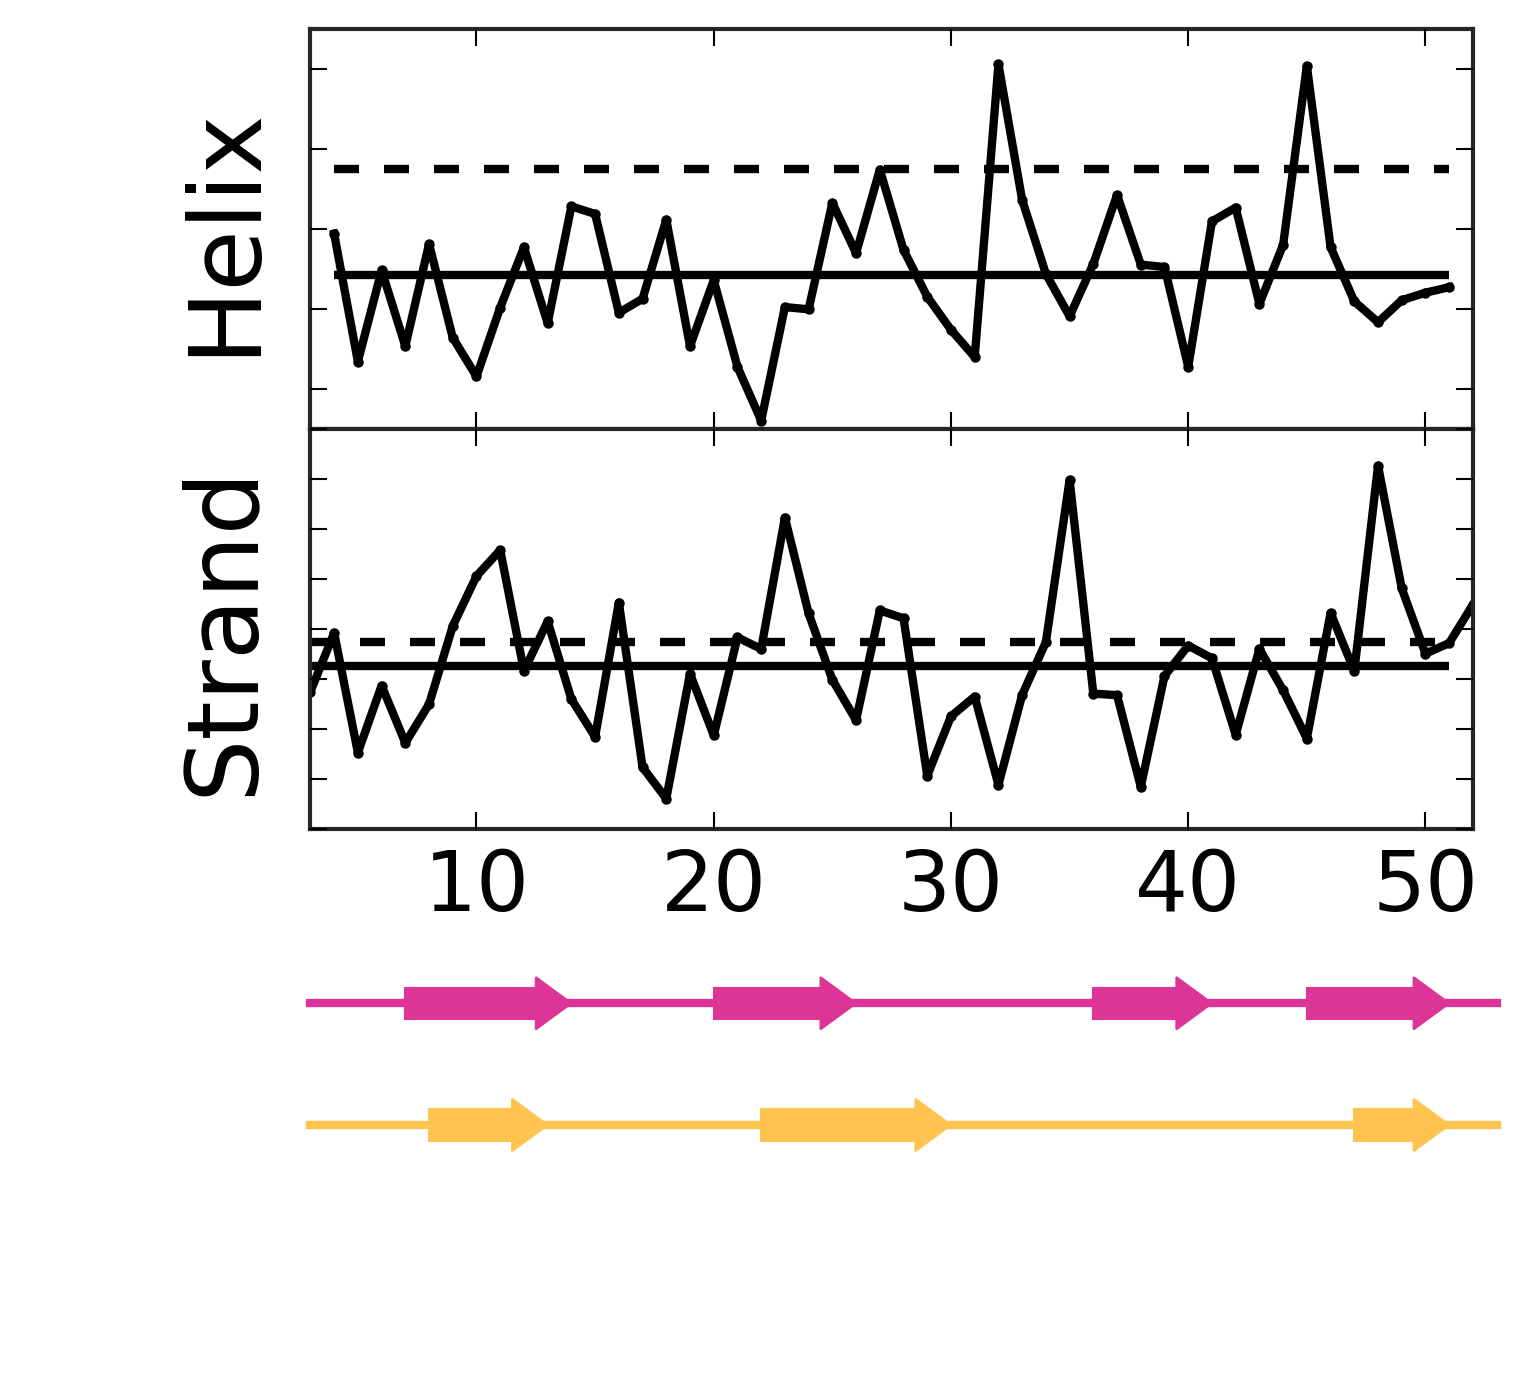
Secondary structure from ECs
EC score distribution and threshold
Top ECs
| Rank |
Residue 1 |
Amino acid 1 |
Residue 2 |
Amino acid 2 |
EC score |
| 1 |
18 |
G |
42 |
V |
1.69 |
| 2 |
19 |
H |
49 |
Y |
1.32 |
| 3 |
35 |
E |
48 |
I |
1.27 |
| 4 |
12 |
V |
52 |
A |
1.01 |
| 5 |
15 |
A |
45 |
Q |
0.92 |
| 6 |
37 |
K |
46 |
H |
0.88 |
| 7 |
19 |
H |
52 |
A |
0.85 |
| 8 |
35 |
E |
50 |
K |
0.85 |
| 9 |
8 |
K |
22 |
T |
0.84 |
| 10 |
37 |
K |
48 |
I |
0.84 |
| 11 |
16 |
G |
40 |
D |
0.77 |
| 12 |
13 |
S |
40 |
D |
0.71 |
| 13 |
21 |
Y |
38 |
K |
0.67 |
| 14 |
30 |
K |
36 |
L |
0.67 |
| 15 |
14 |
S |
50 |
K |
0.63 |
| 16 |
43 |
V |
47 |
V |
0.62 |
| 17 |
8 |
K |
24 |
T |
0.59 |
| 18 |
39 |
F |
44 |
R |
0.59 |
| 19 |
30 |
K |
34 |
L |
0.59 |
| 20 |
12 |
V |
19 |
H |
0.56 |
| 21 |
16 |
G |
43 |
V |
0.56 |
| 22 |
7 |
E |
27 |
K |
0.54 |
| 23 |
25 |
K |
51 |
E |
0.54 |
| 24 |
6 |
R |
27 |
K |
0.53 |
| 25 |
13 |
S |
49 |
Y |
0.48 |
| 26 |
11 |
L |
23 |
T |
0.48 |
| 27 |
37 |
K |
45 |
Q |
0.46 |
| 28 |
6 |
R |
30 |
K |
0.43 |
| 29 |
20 |
F |
49 |
Y |
0.43 |
Alignment robustness analysis
First most common residue correlation
Second most common residue correlation